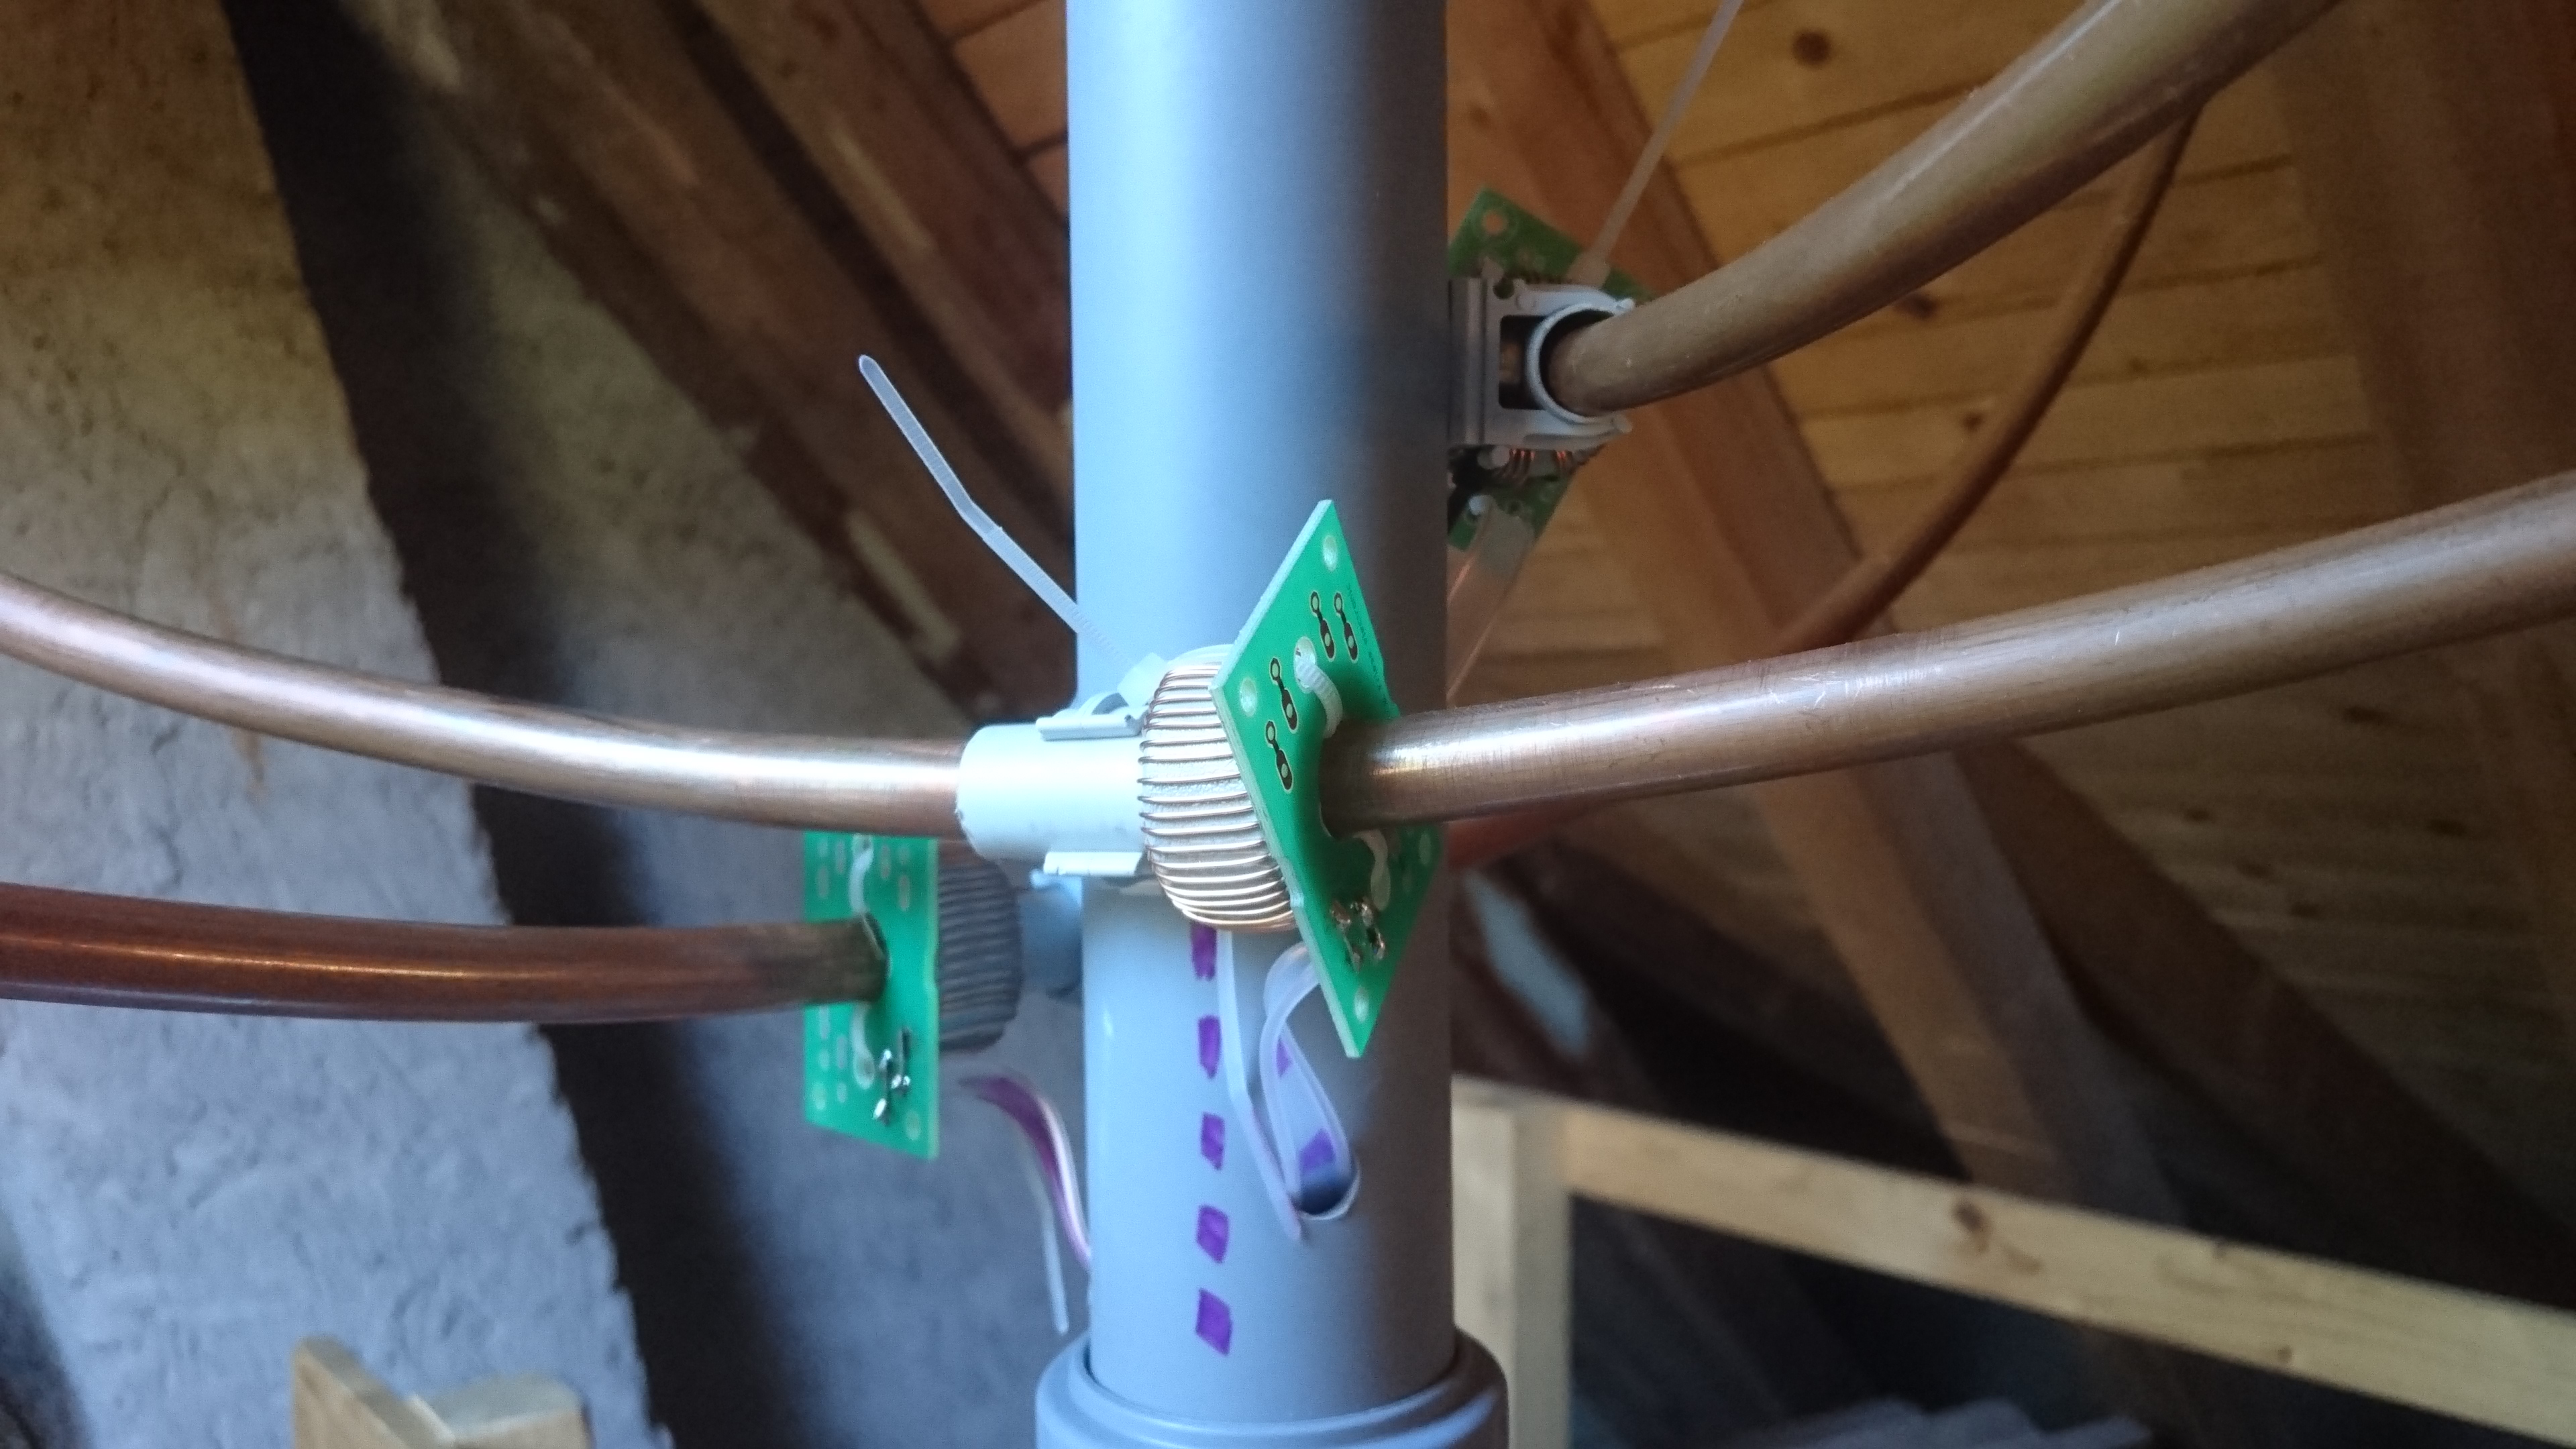
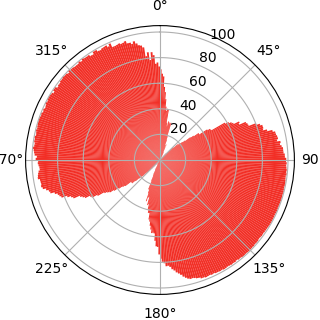
Three loops with one winding using transformer of channel 1A (red) above, and an E-field antenna 130 mm (2019.10.26 12:08 - now).

antenna comparison
last day


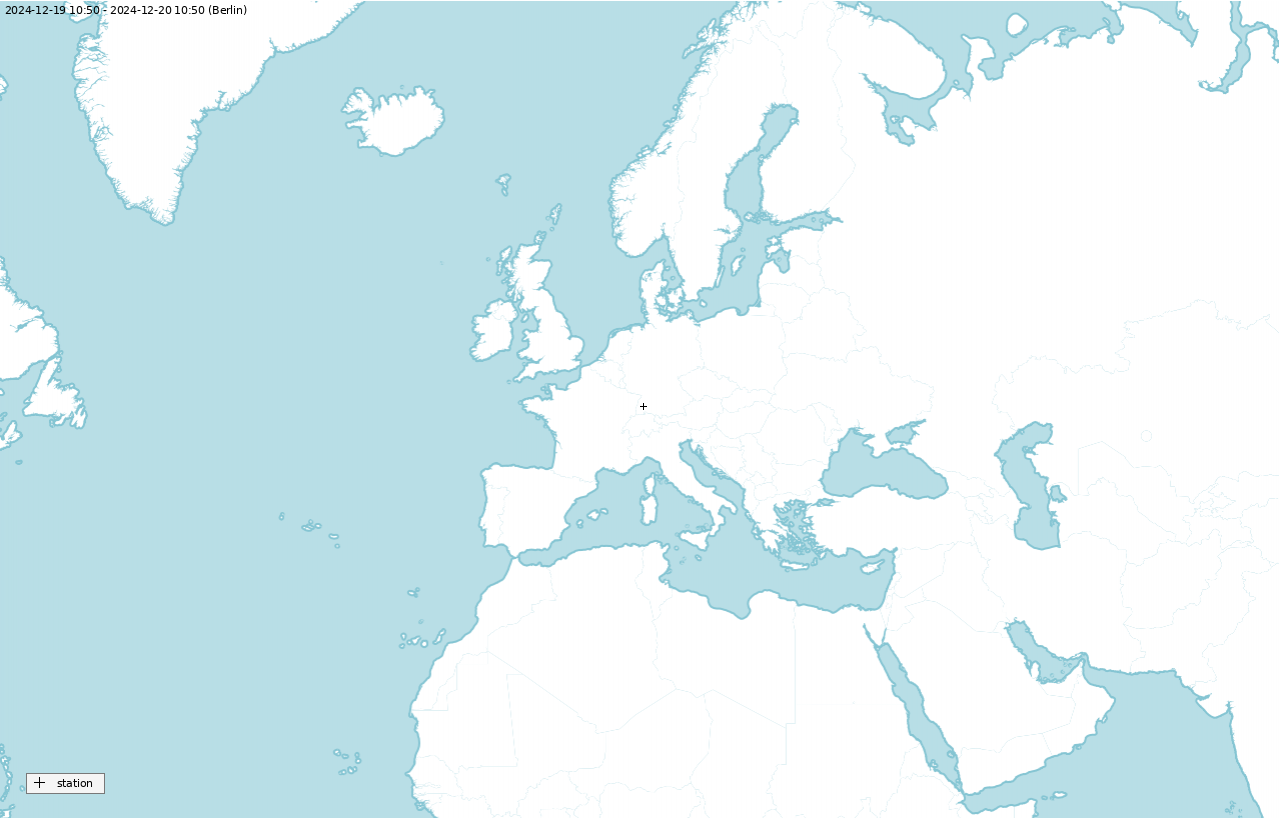
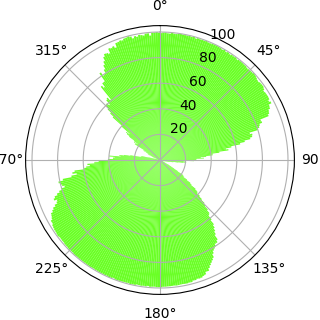
1000 / 40 = 25 most distant strokes for each segment of 360 / 40 = 9 degrees around the sation
Up to four dots per stroke, one for each antenna. The dots are misplaced by +/- 0.5 pixel compared to the calculated position.
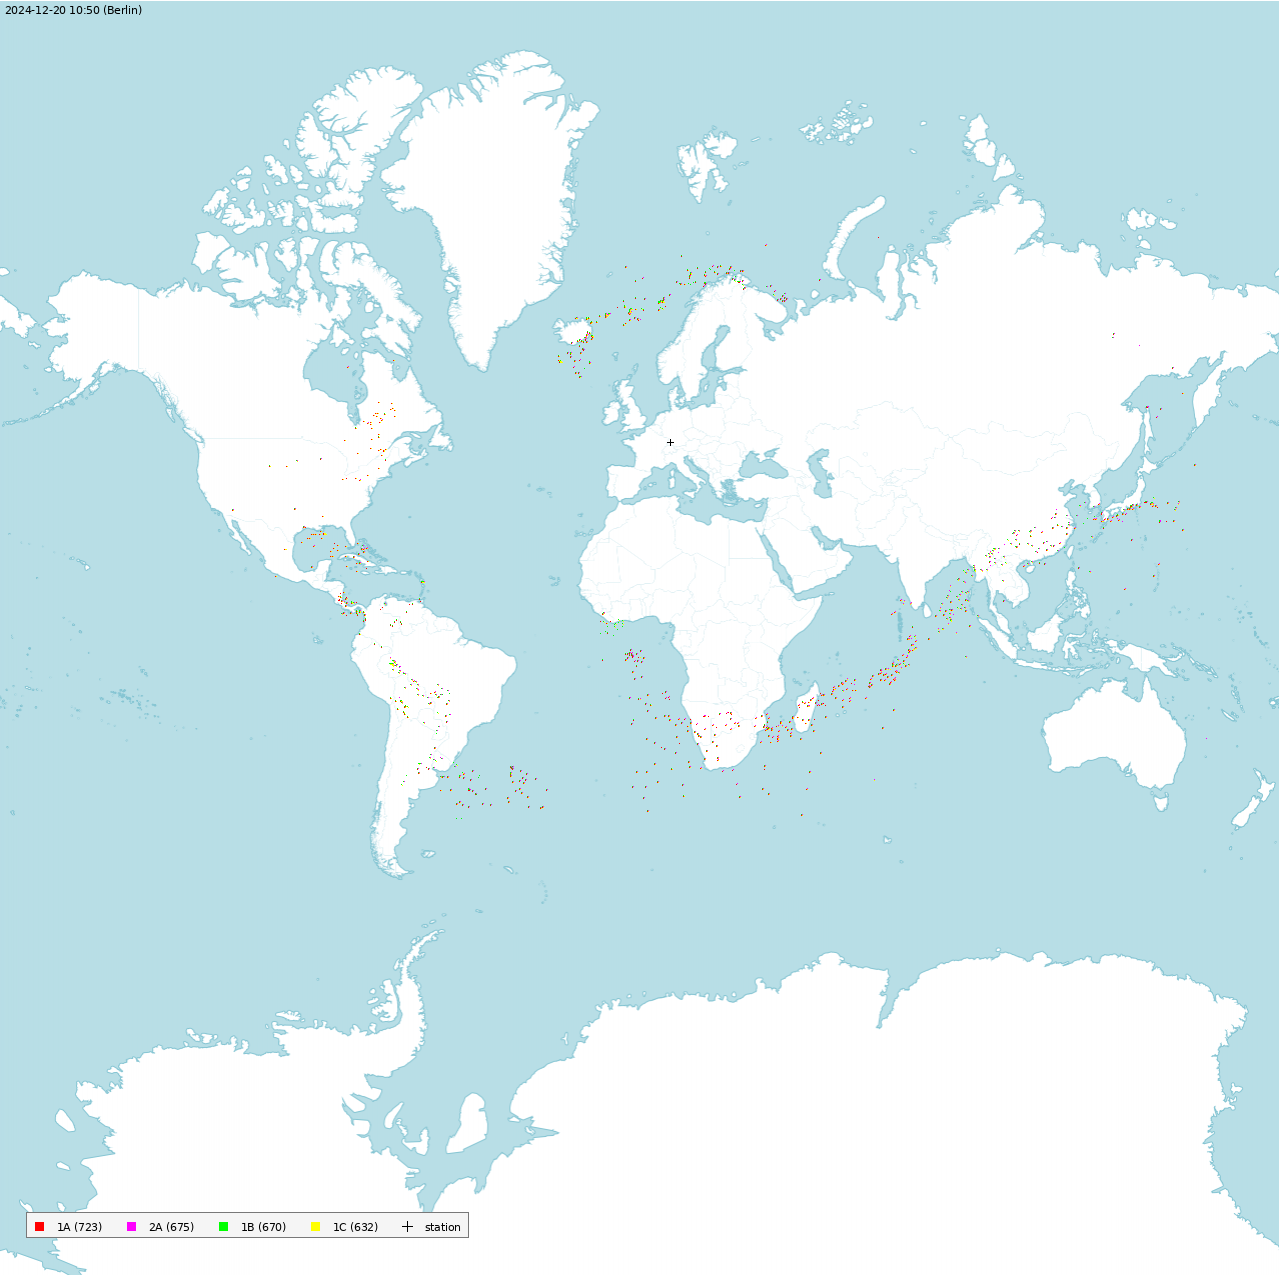
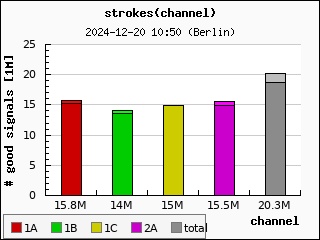
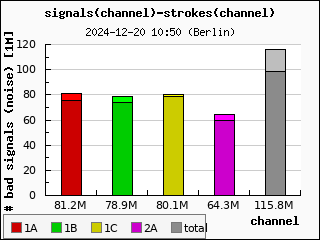
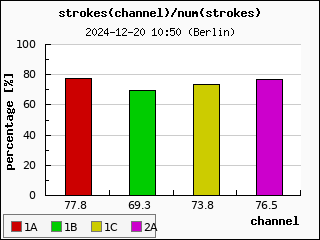
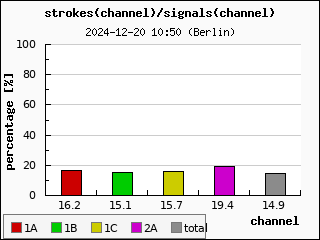
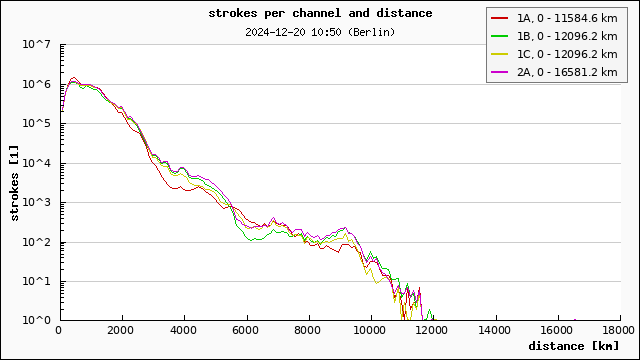
1A (red) is bottom left, 1C (yellow) is bottom right, 1B (green) is top left, 2A (violet) is top right
24 hours

last hour


last day

since the start of the recording
last day